







Read the Full Series
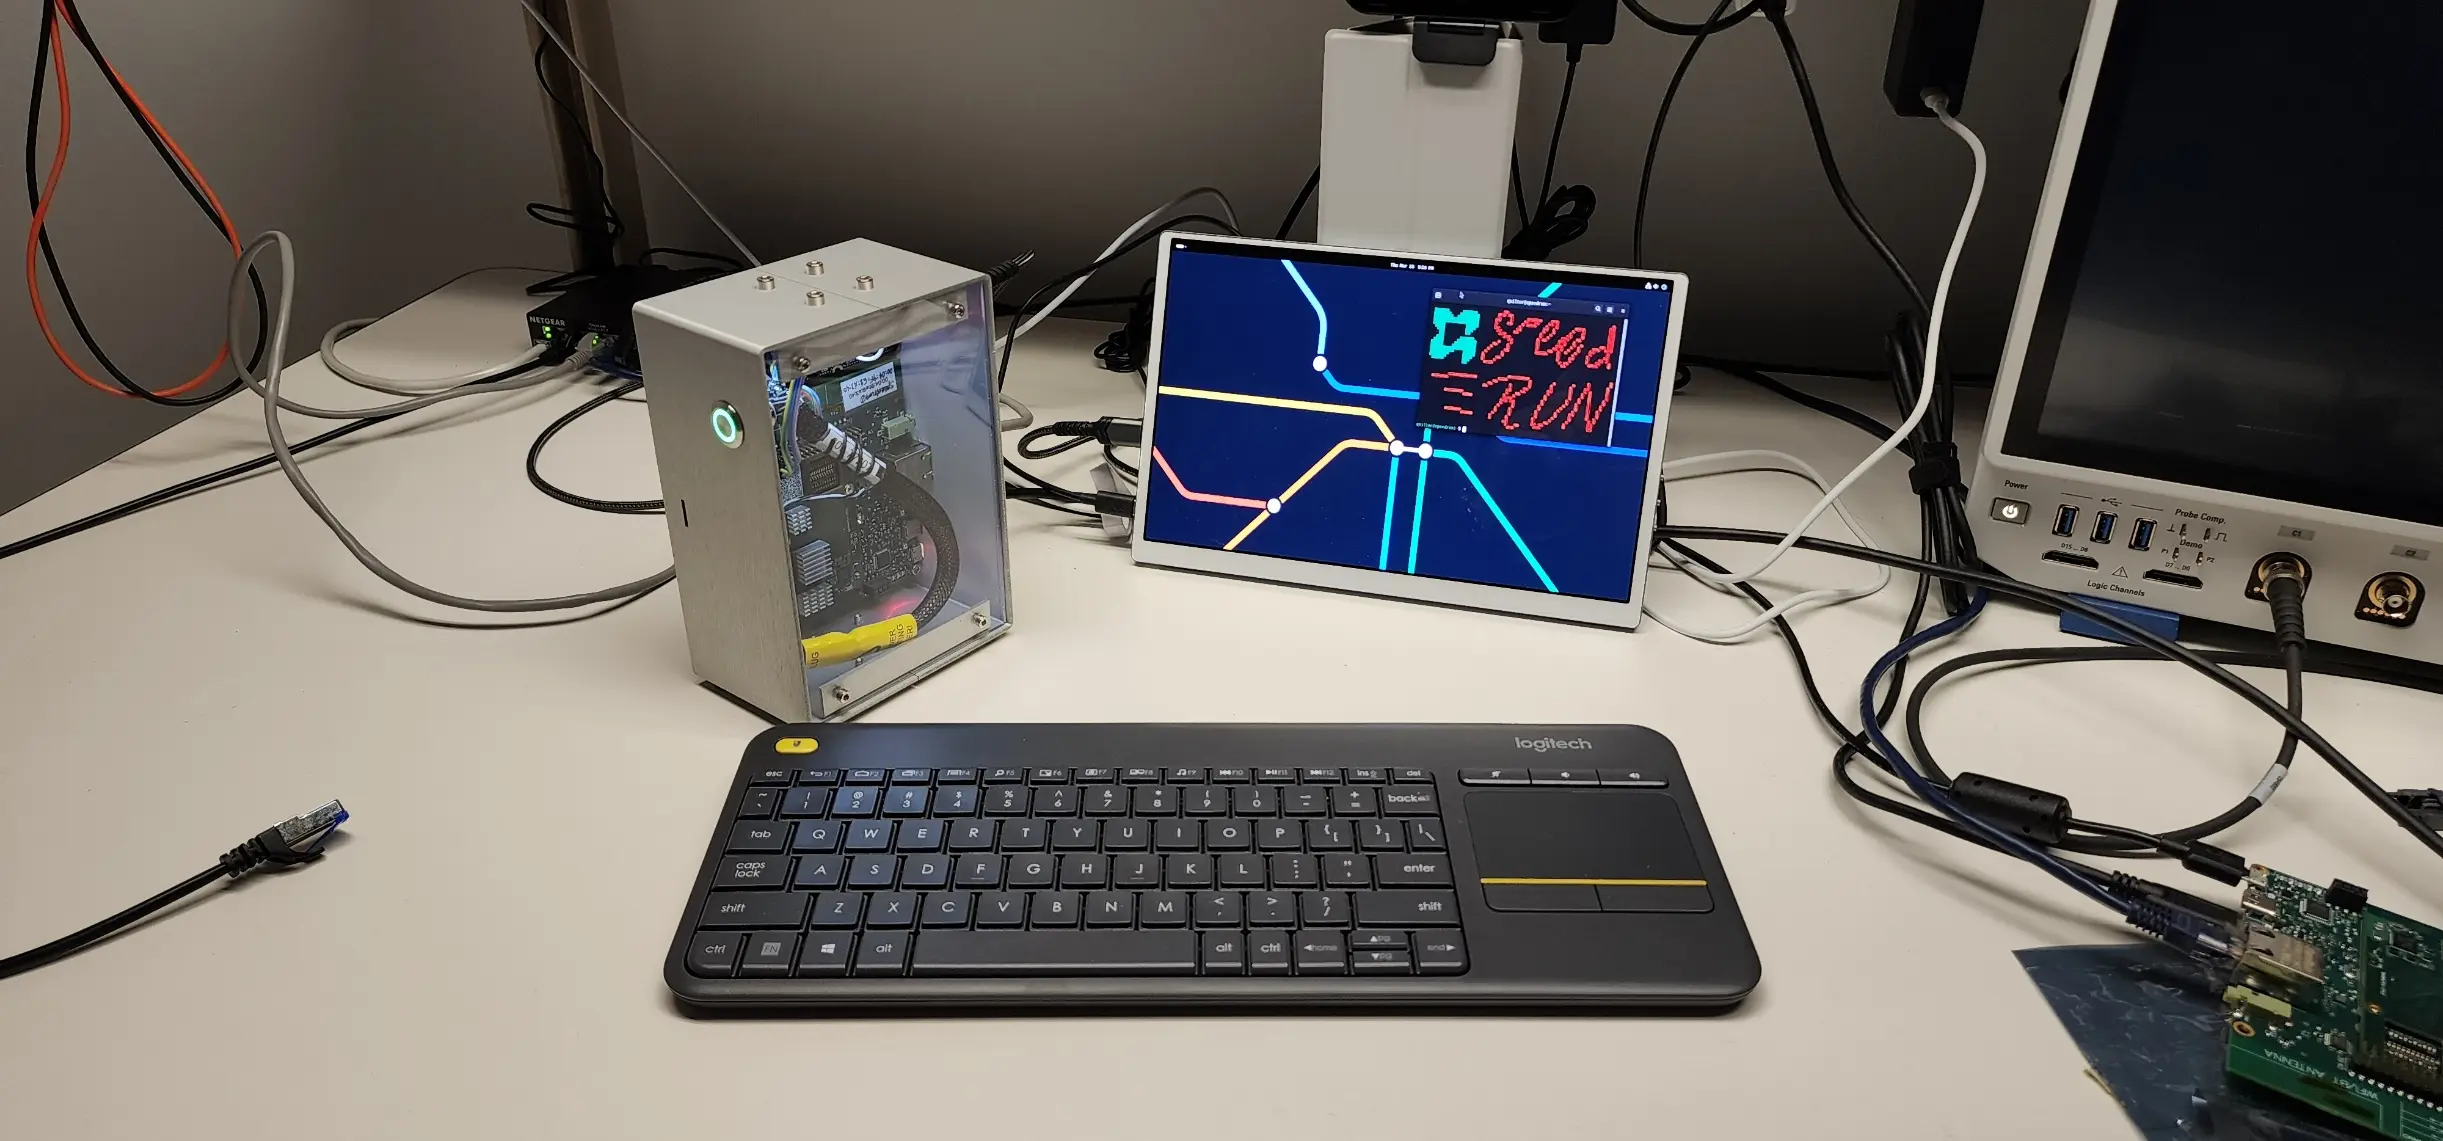
This article is one part of a walkthrough detailing how we recreated an NXP i.MX 8M Mini–based computer using Quilter’s physics-driven layout automation.
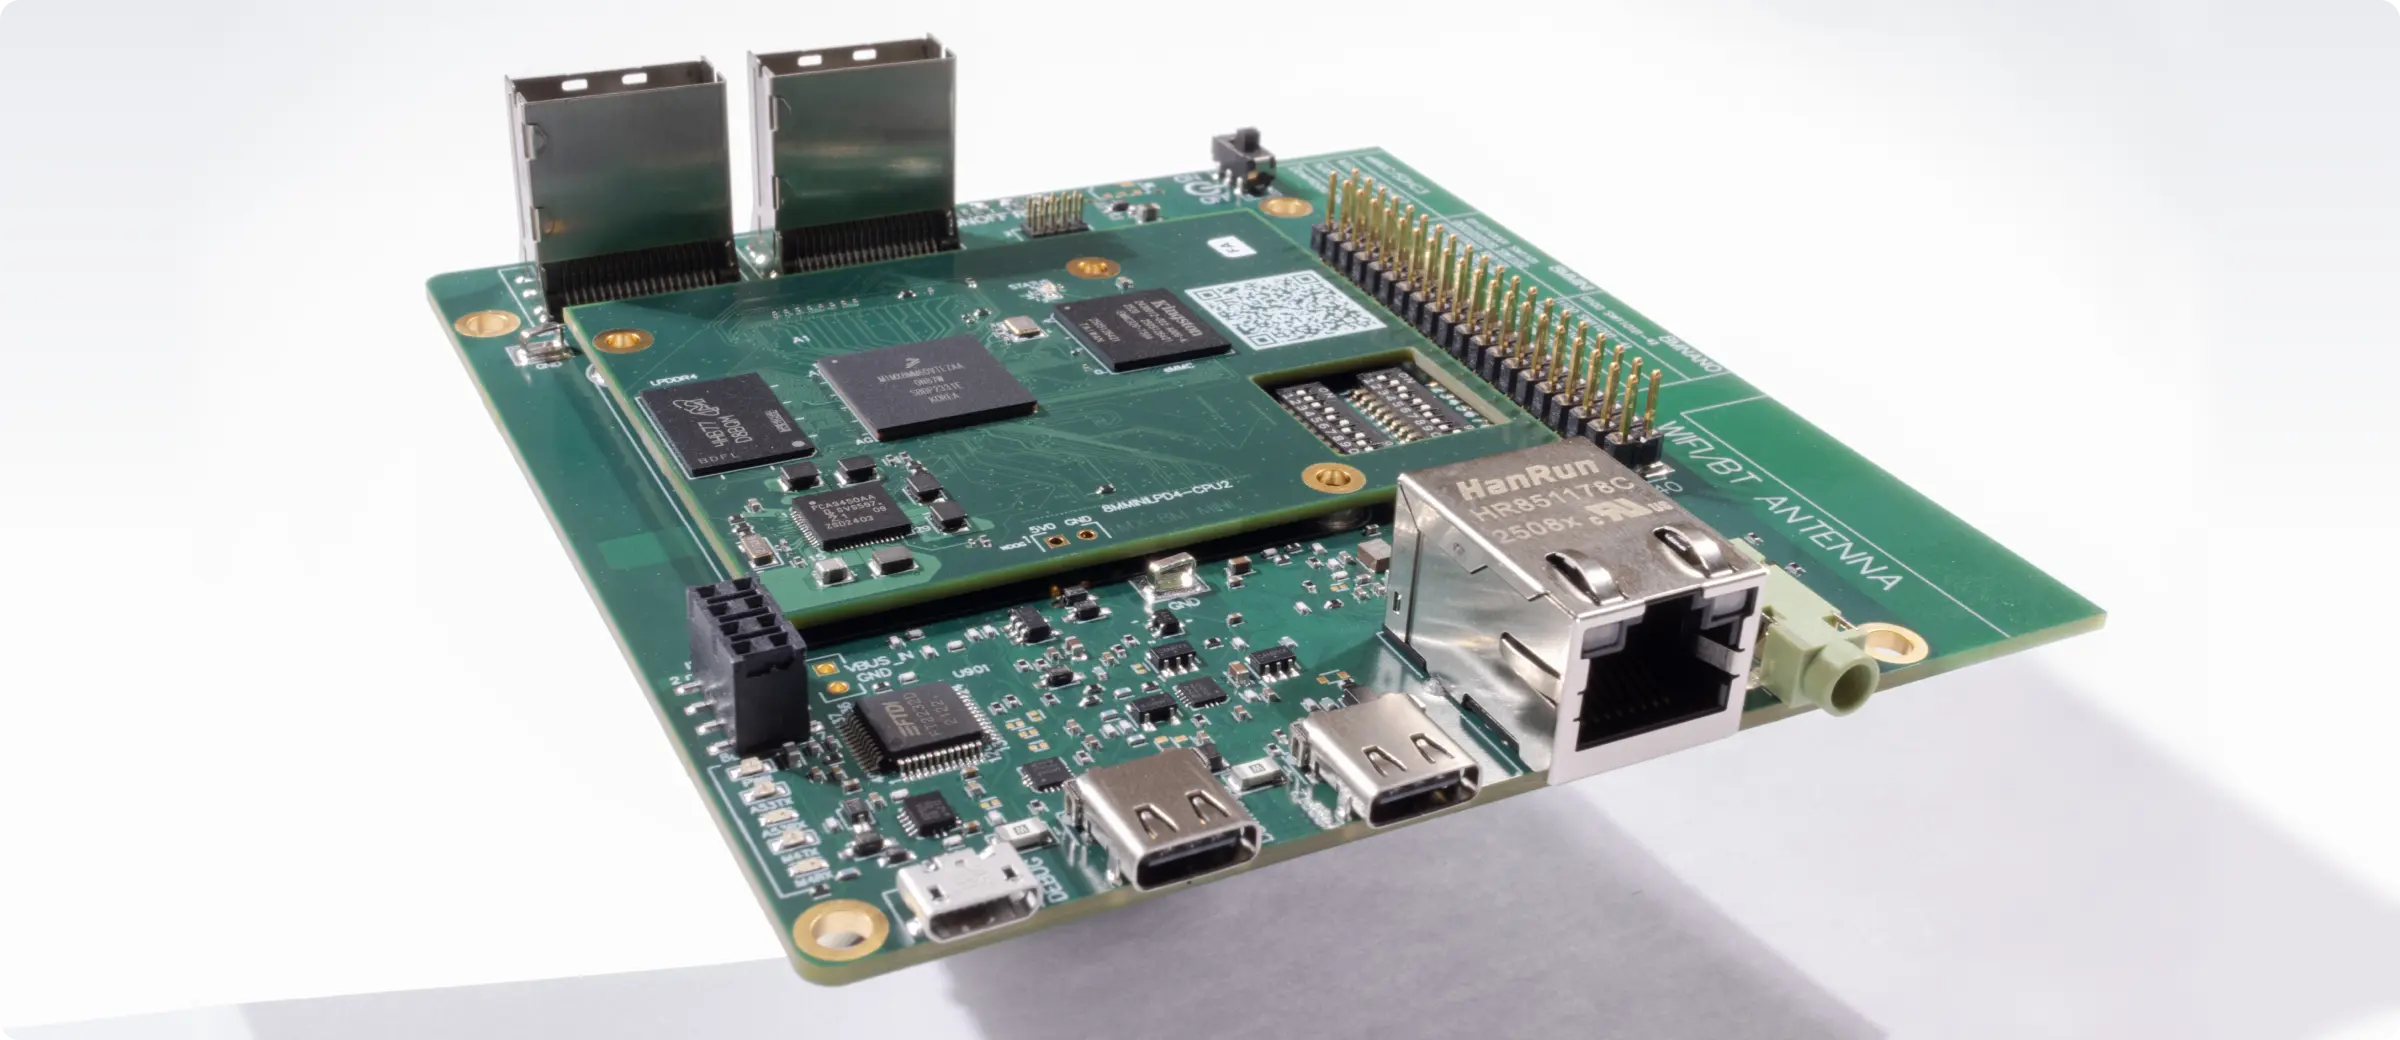
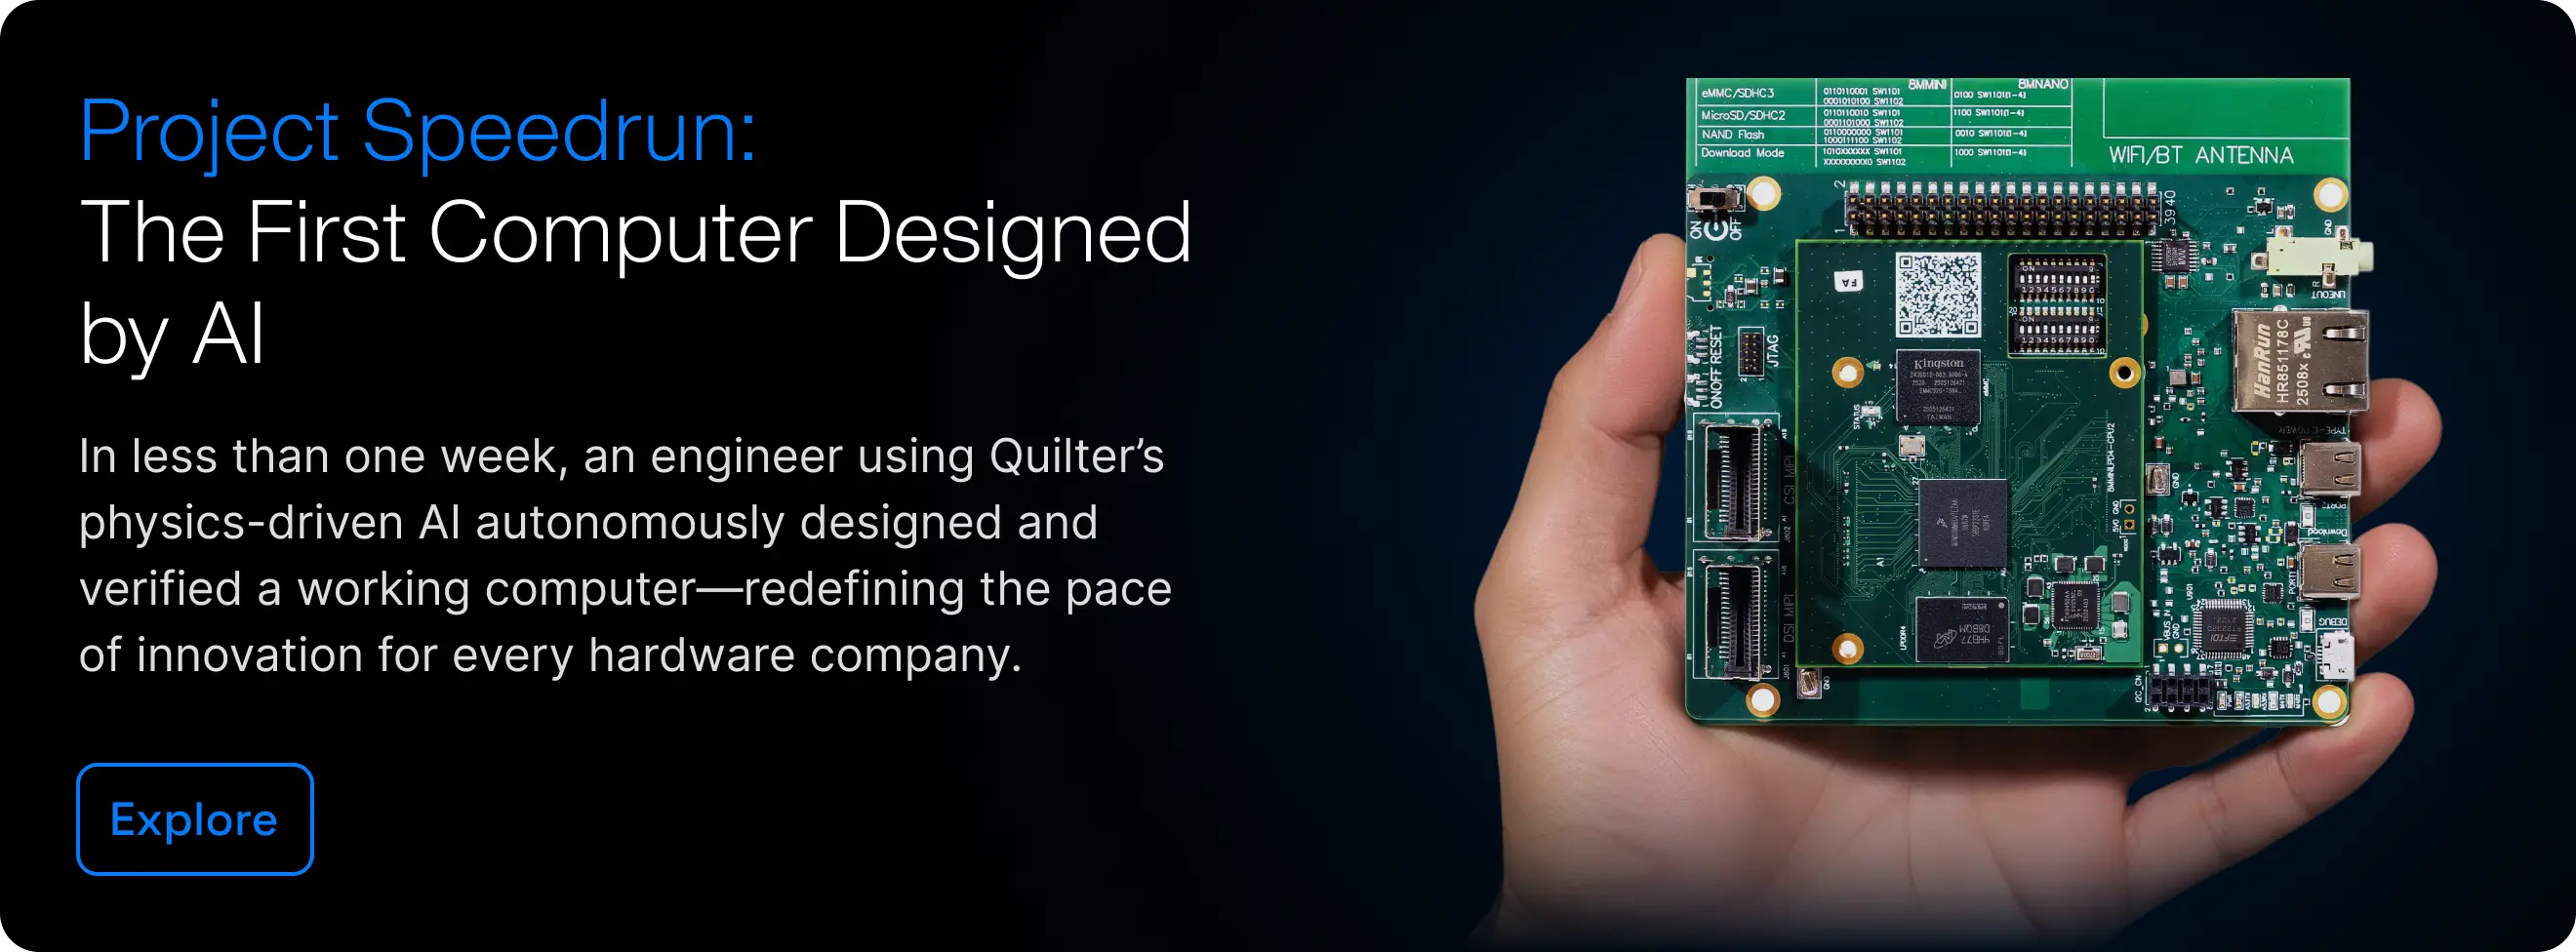
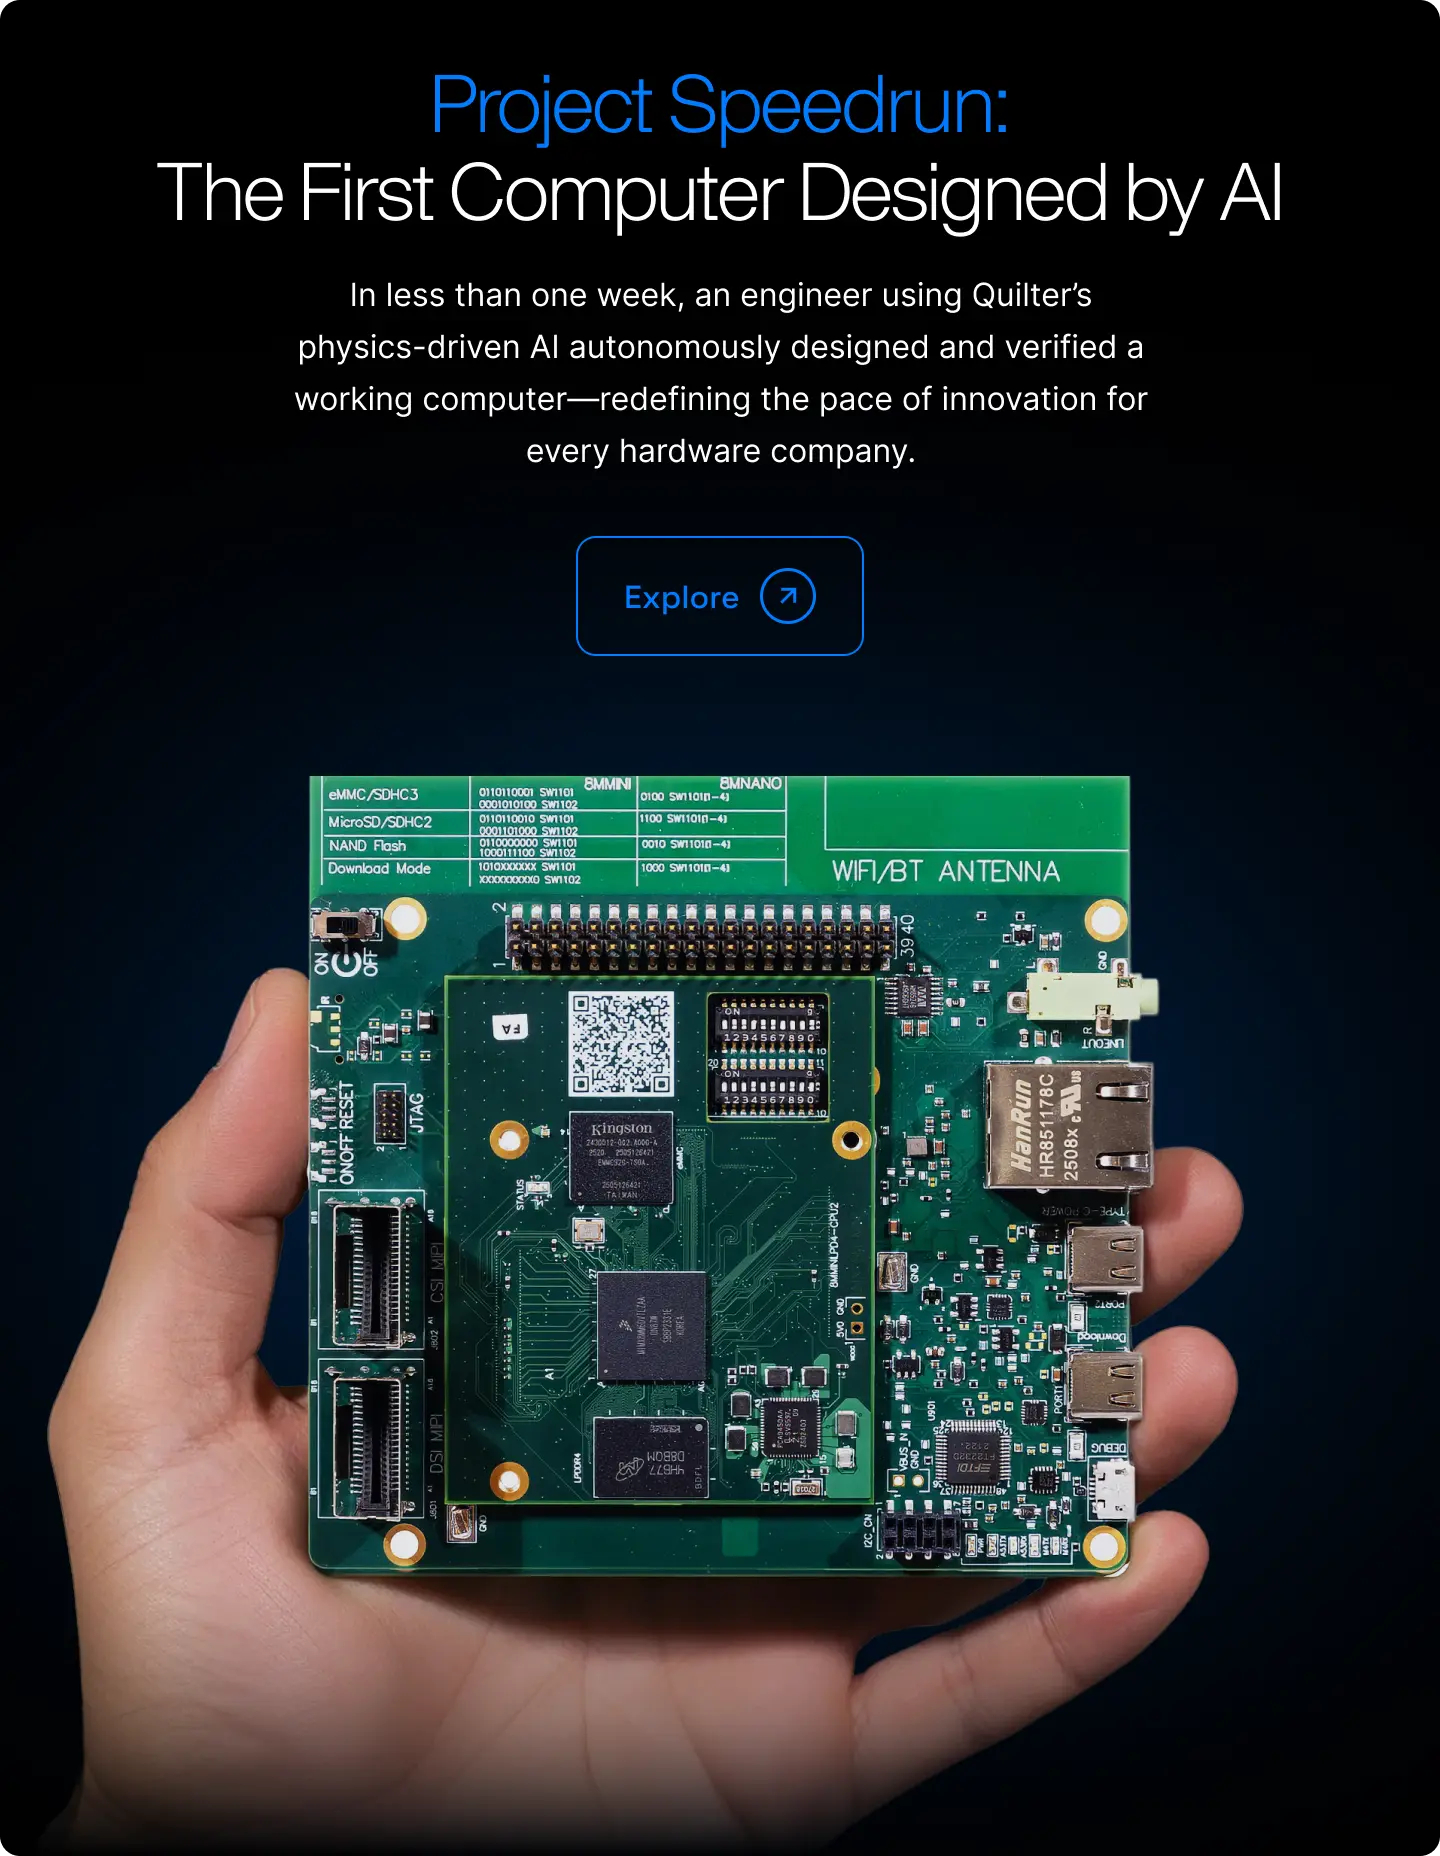
Project Speedrun produced an AI-designed dual-PCB computer, a system-on-module and baseboard that run Linux on NXP’s i.MX 8M Mini. Quilter’s physics-driven AI placed and routed the boards, and an engineer then spent 38.5 hours on cleanup. The validation results covered workloads from Ethernet speed tests to hardware-accelerated video playback, and listed EMI/EMC scans as remaining work.
EMI was also the most common criticism of Speedrun. The usual version went: AI can design a PCB that works, but the question was asked, “how does the EMI compare?”
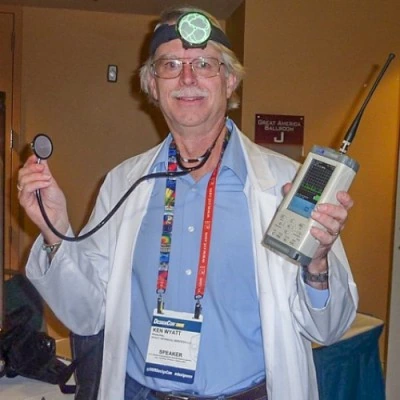
Ken Wyatt, one of the most respected EMC engineers in the electronics industry, put that assumption to the test. He has spent more than 30 years finding and fixing EMI problems, including about 21 years as a division EMC engineer at Hewlett-Packard. He writes monthly EMC columns for Signal Integrity Journal and InCompliance Magazine and co-wrote the EMI Troubleshooting Cookbook for Product Designers. Between July and September 2026, he ran EMC pre-compliance tests on three Speedrun samples and one board built from NXP’s own reference design, using a transverse electromagnetic (TEM) cell in his lab.
On radiated emissions, the AI-designed board measured better than the board built from NXP’s design. In the September 14 comparison, the Speedrun trace sat below the NXP-design trace through much of roughly 250 to 650 MHz, and its likely Ethernet clock harmonics were lower as well. In addition, the power conversion EMI level from about 10 to 250 MHz was about 5 dB lower. Reviewing a live sweep on September 17, Ken estimated the gap at about 12 dB in part of that range. In a separate session, the three Speedrun samples produced closely overlapping traces.
This write-up is based on a recorded conversation between Ken and Ben Jordan, Quilter’s staff electrical engineer, and on the measurement data Ken provided. The full recording is embedded at the end of the post.
Key Findings
- Lower emissions than the NXP-design board through much of 250 to 650 MHz. In the September 14 comparison in Figure 1, the Speedrun sample’s trace sits below the NXP-design board’s through much of this range. On a live sweep during the September 17 recording, Ken estimated the gap at about 12 dB in part of it. In addition, broadband DC-DC converter EMI from 10 to 250 MHz was about 5 dB lower.
- Lower likely Ethernet clock harmonics. The tallest narrow peaks on the NXP-design board, likely Ethernet clock harmonics, were lower on Speedrun. Both designs use the same Ethernet PHY part number.
- Close agreement across samples in one session. In the September 4 sweeps, the three Speedrun samples produced closely overlapping traces.
- A bench comparison under documented conditions. The plots show signal level at the TEM cell output in dBµV. Because these are near-field measurements, they do not predict compliance margins at a 3 m or 10 m test distance.
The Main Comparison
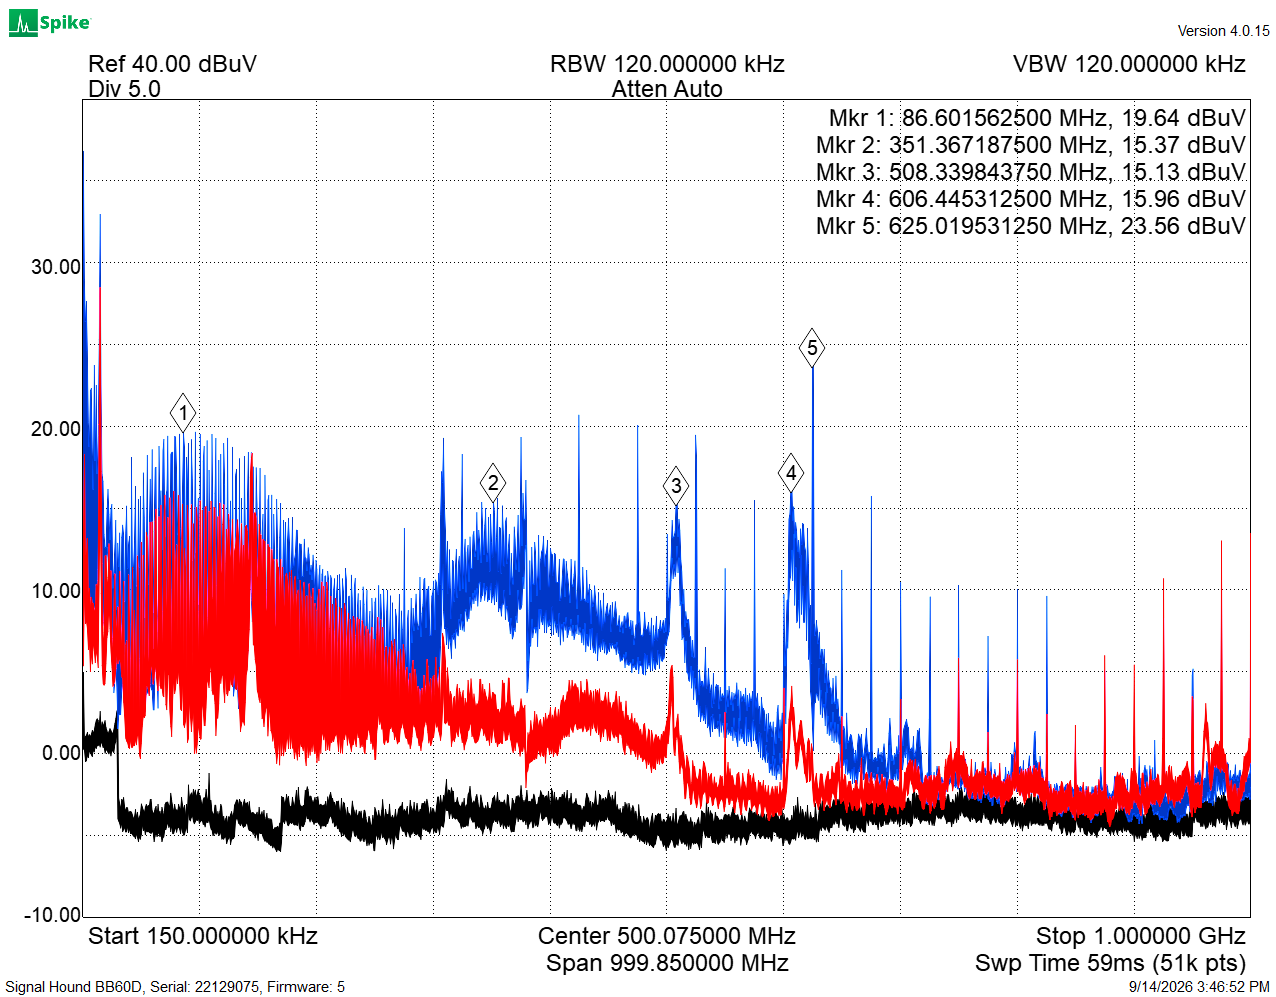
Figure 1 is a September 14 sweep, captured with the same span, resolution and video bandwidth, reference level, and scale as the live sweep in the September 17 recording. The horizontal axis is linear, at about 100 MHz per division, and the vertical axis is signal level at the TEM cell output in dBµV.
Through the middle of the band, roughly 250 to 650 MHz, the Speedrun trace runs well below the NXP-design trace. Reviewing the live September 17 sweep, Ken put the gap at about 12 dB: “This whole area in the middle is substantially lower than the NXP board... there’s about a 12 dB difference here.” That figure is a visual estimate for the part of the sweep under discussion. The separation varies with frequency, and the markers report only the blue trace. At marker 2 (351 MHz), for example, the NXP-design trace reads 15.37 dBµV.
The result surprised Ben. A signal integrity review had flagged a memory data line routed over a void in the ground plane (covered below), and the design has about 13 power supplies, 11 or 12 of them switching regulators with high-frequency current loops. “I did not expect our board, designed by Quilter’s AI, to come out with a lower harmonic content than the original,” he said.
An Earlier Sweep Showed the Same Ordering
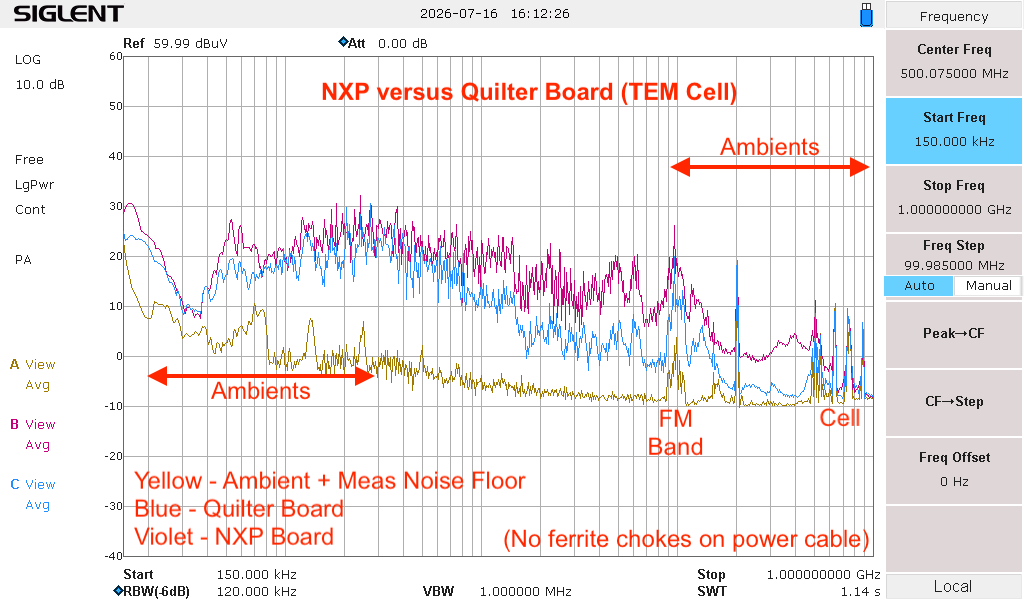
Because this sweep used a different analyzer and display settings, its curves look different from Figure 1. Moreover, the July 16 measurement did not use the TEM cell within a shielding tent, therefore ambient radiation is higher. The ordering of the two boards is the same.
Likely Ethernet Clock Harmonics
The tall, narrow lines on the blue trace in Figure 1, which Ken identified as likely Ethernet clock harmonics, are the largest discrete emissions from the NXP-design board. The same harmonics appear on the Speedrun trace at substantially lower amplitude on average. This was the difference Ken singled out: “I was impressed with the performance of the board from an EMC perspective, especially the fact that there was such a difference in the Ethernet clocks, the amplitude of those.”
Both designs use the same Ethernet PHY part number in roughly the same location, which controls one component-level variable. The measurements do not isolate which layout, stack-up, or operating-state differences produced the lower peaks. One candidate is the stack-up, since the Speedrun layer stack differs from NXP’s original.
Switching Regulator Noise
Ken attributes the broadband energy on the left side of each sweep to DC-to-DC converter switching, and the peak in the middle of the band to a likely resonance of that switching. Both boards show it, which is expected for a design with this many switching regulators.
Separating Board Emissions From Ambient Signals
The black trace in Figure 1 is the ambient level with the shield tent closed. The small peaks near 100 MHz are likely FM broadcast stations, and the large spikes near the top of the band are likely cellular transmissions leaking through the tent. Neither board has a cellular radio, and the optional wireless module was not fitted on either. Where the traces approach the ambient floor, small differences between them carry little meaning.
Three Speedrun Samples
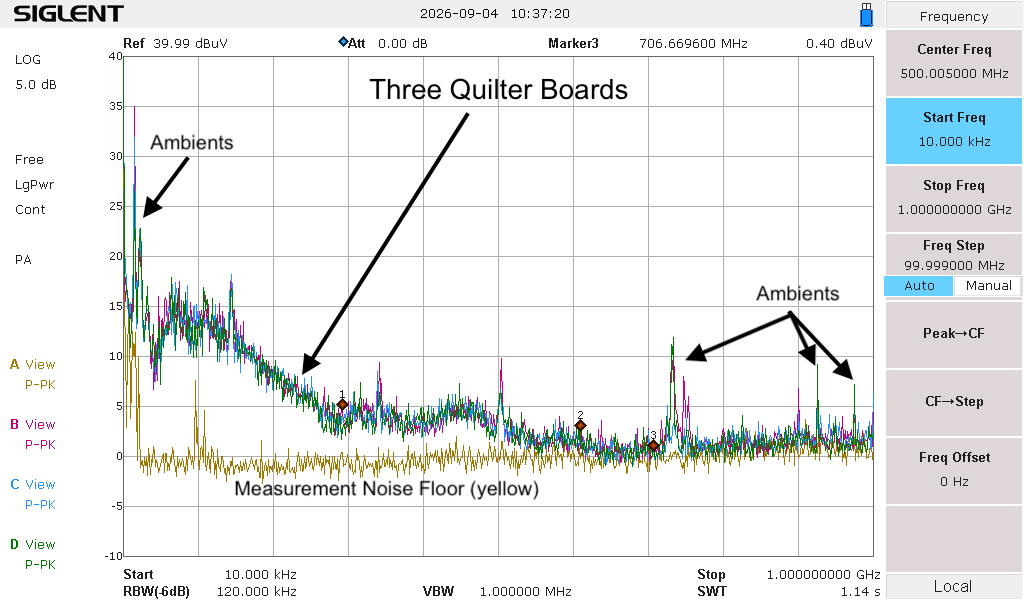
One sample per design is a thin basis for comparison, so all three Speedrun samples were also measured on September 4. Figure 3 overlays the results.
EMC Pre-Compliance Test Setup
EMC pre-compliance testing helps engineers find and investigate emissions before formal assessment, when compliance lab time is limited and expensive. Pre-compliance is Ken’s specialty, and here he used a TEM cell to compare the boards’ measured emissions on the bench.
A TEM cell is a 50-ohm transmission line expanded so a small board fits inside it. The center plate, or septum, acts as the center conductor and the outer plates act as the shield. With a spectrum analyzer on one end and a 50-ohm load on the other, emissions from the board couple to the septum and appear on the analyzer. That makes the cell useful for comparing one board against another on the bench.
The plots show the voltage at the cell output in dBµV, not calibrated field strength at a test distance. In his article on TEM cell troubleshooting, Ken writes that a TEM cell measurement “will not necessarily compare with a measurement using a calibrated EMI antenna at a 3 or 10m test distance,” and that a reduction measured in the cell does not necessarily produce the same reduction at those distances.
Detail | Setup |
Samples | Three Speedrun samples (system-on-module on baseboard) and one board built from NXP’s i.MX 8M Mini EVK design files |
NXP-design board | Built by Quilter at Sierra Circuits from NXP’s design files; not a purchased EVK |
Laminate and stack-up | NXP-design board: VT47 at Sierra’s request, in place of the TU768 NXP specifies. Speedrun boards: VT47, with a stack-up that differs from NXP’s |
Software | Same Linux image and firmware revision on all boards; workload and Ethernet link activity during the sweeps not recorded |
Ethernet | Same MAC and PHY part numbers; wired Ethernet only, wireless module not fitted |
Power and cables | USB-C power, with four Tokin ESD-SR-160 ferrite chokes on the cable |
Cell and shielding | Tekbox TBTC2 TEM cell, DC block, 50-ohm load, Langer EMV shield tent from the ESA-1 set |
Analyzers | Siglent SSA3032X on July 16 and September 4; Signal Hound BB60D with Spike software on September 14 and 17 |
Settings | 120 kHz resolution bandwidth; averaged traces on July 16, positive peak on September 4, max hold in the September 17 recording; trace mode for the September 14 files not recorded |
Span | 150 kHz to 1 GHz; 10 kHz to 1 GHz on September 4 |
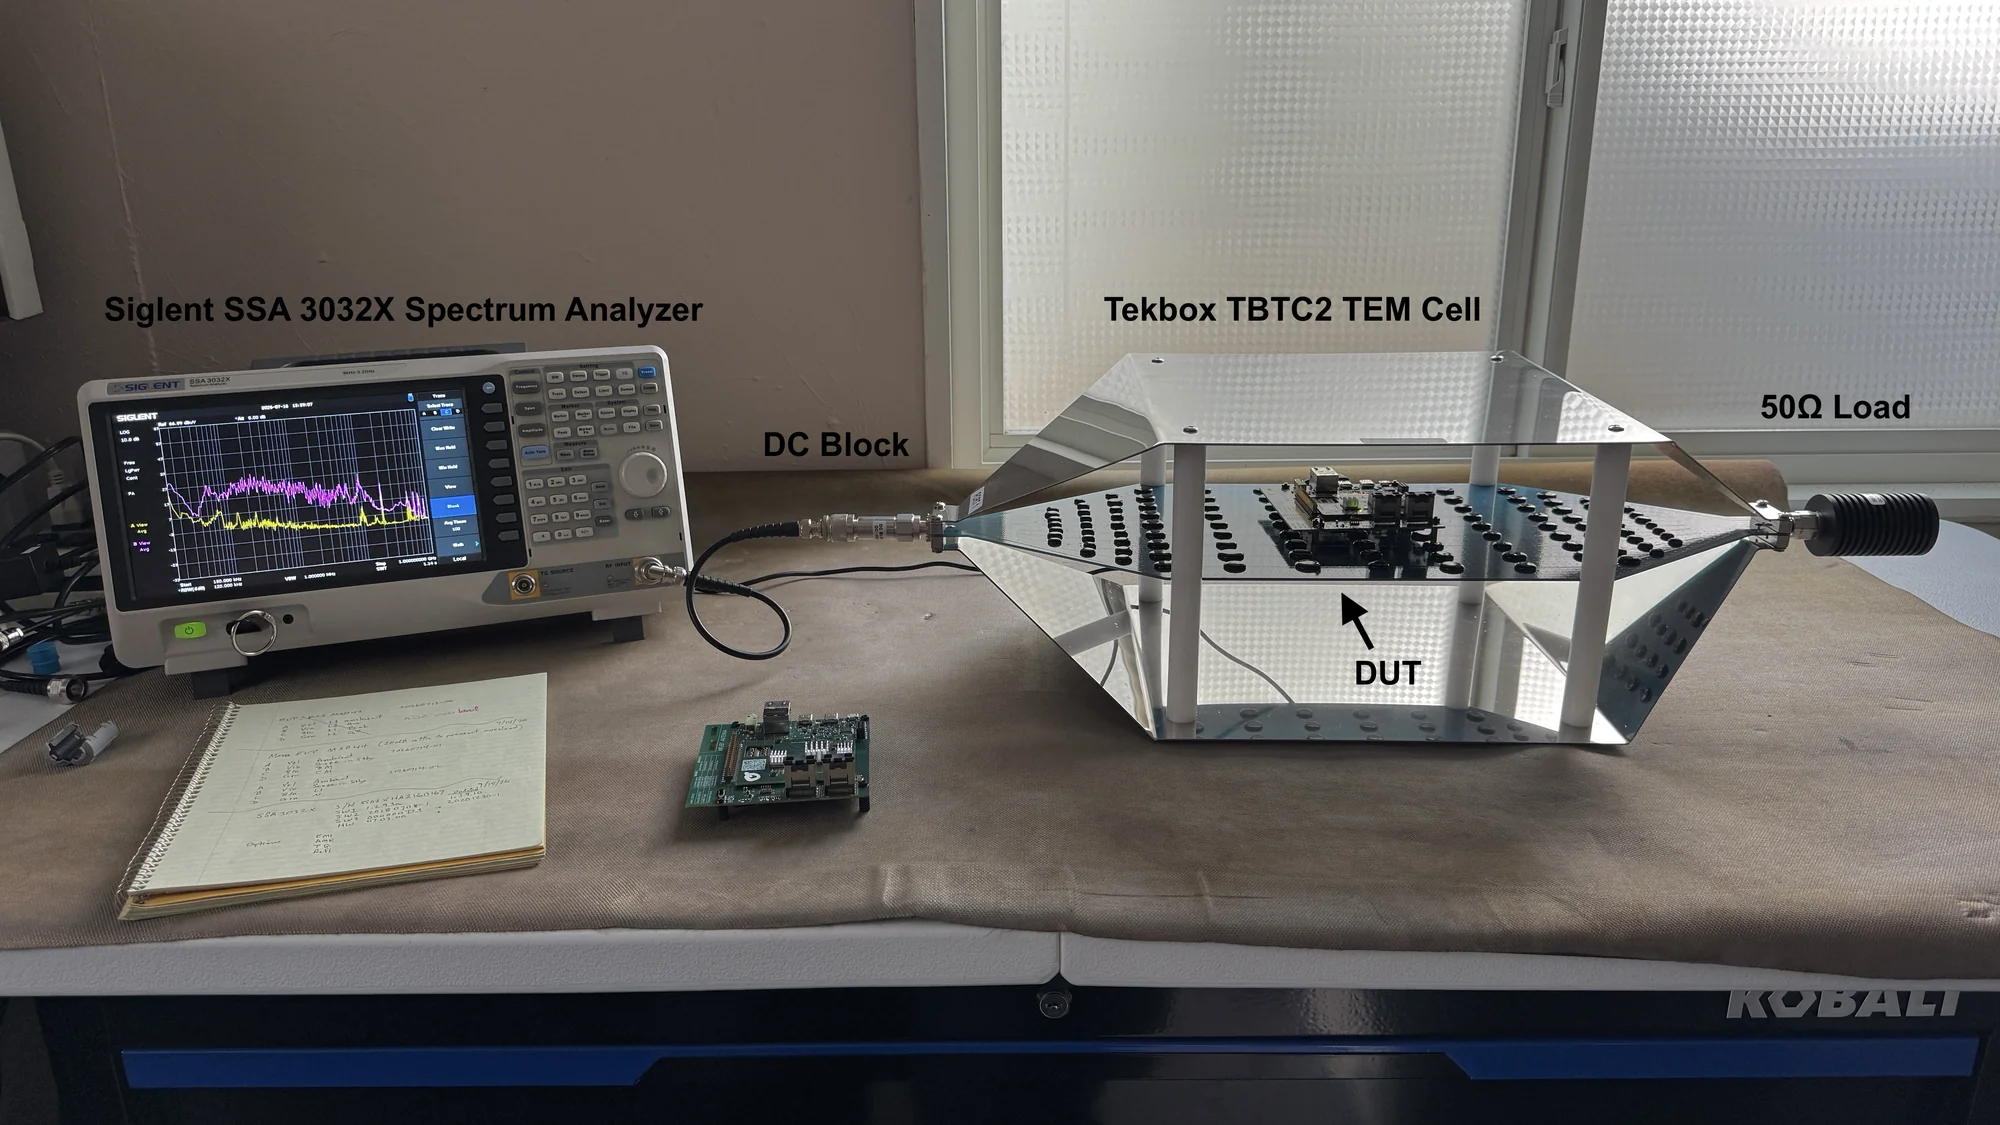
In the July setup in Figure 4, the board sat on top of the cell’s septum. For the September sweeps, it sat on foam in the lower half of the cell. The field between the plates is uniform and the cell is much wider than the board, and Ken’s published guidance advises keeping the board some distance from the plates and the septum.
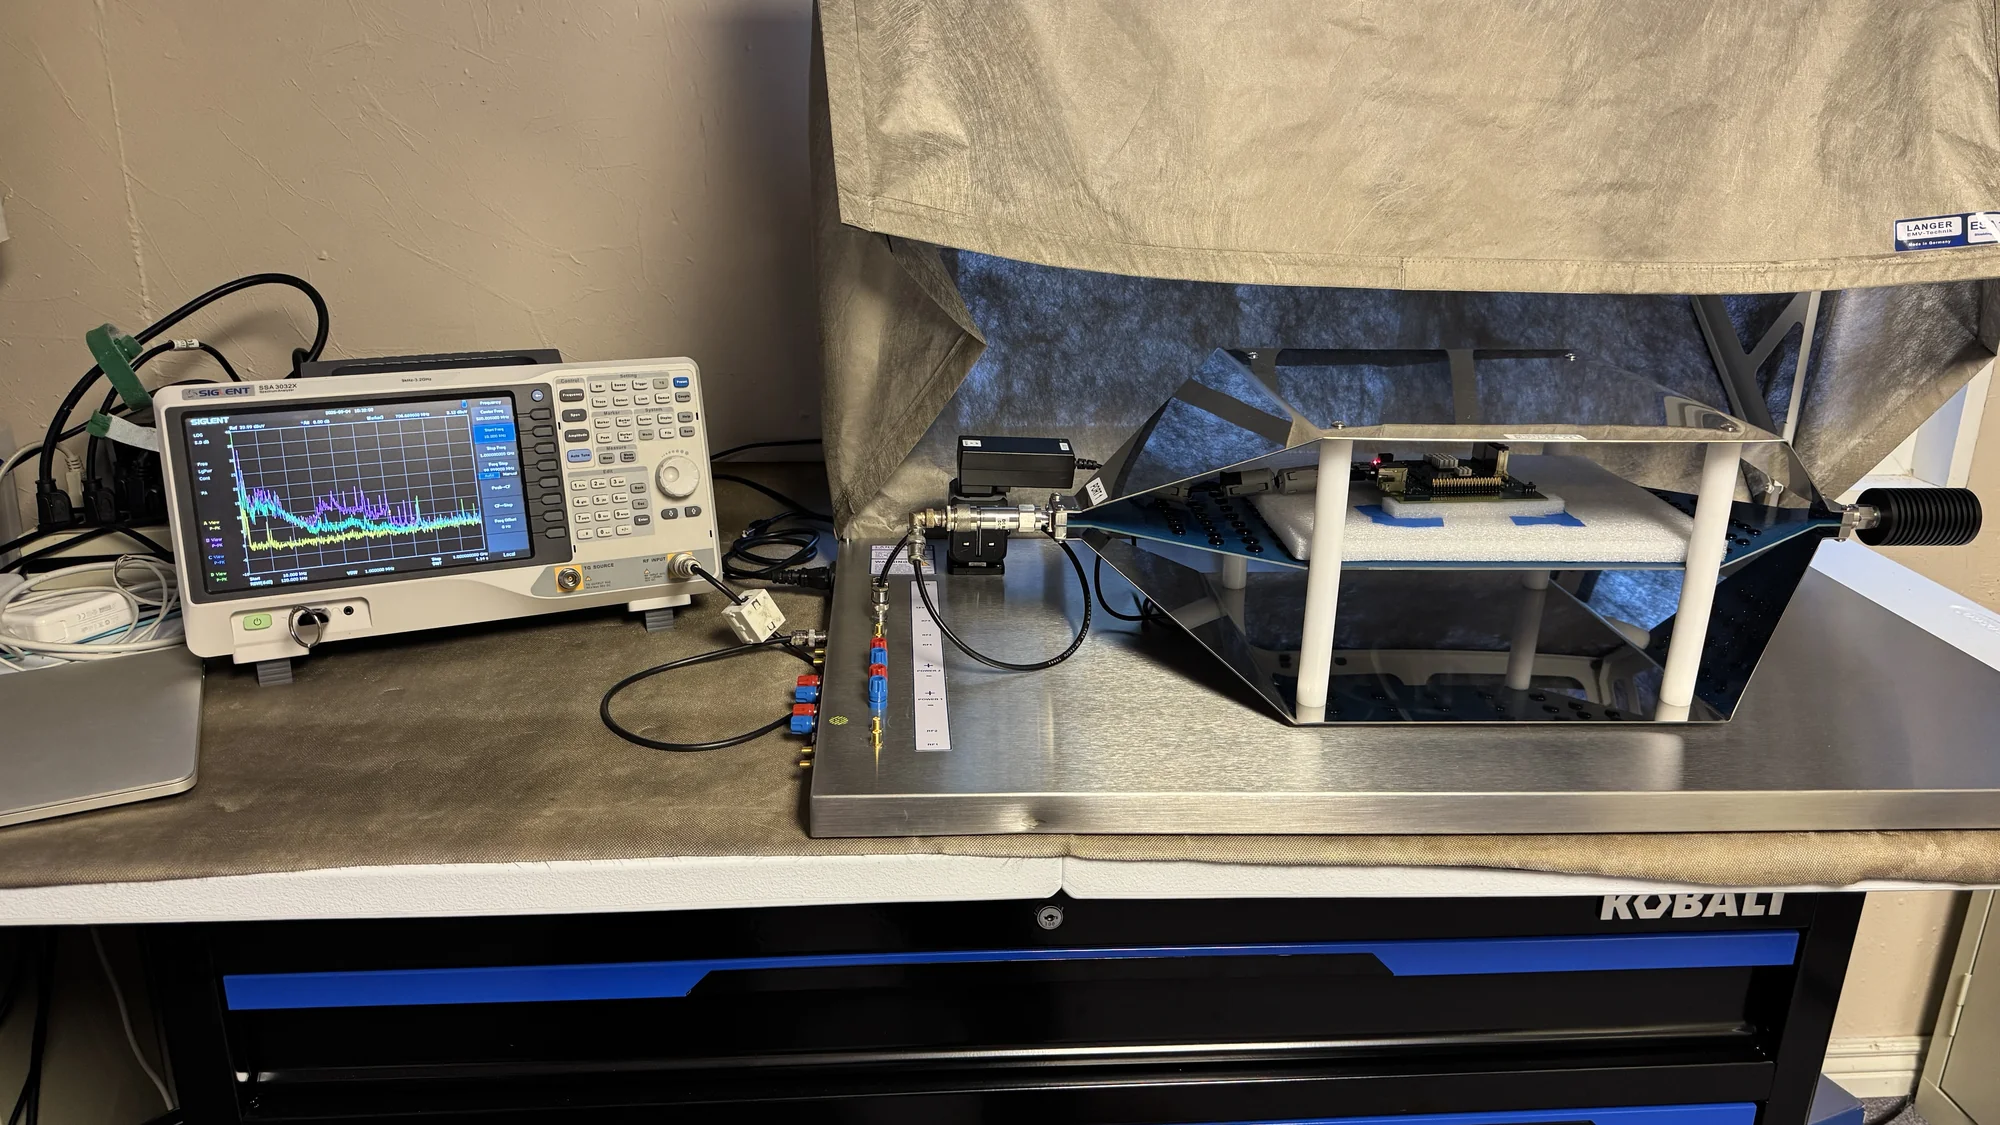
The cell sat inside a shield tent from Langer EMV, made of metalized fabric with magnetic strips that seal it to the base plate. It blocks most ambient signals such as FM broadcast, TV, two-way radio, and cellular, so the noise floor stays low enough to compare boards.
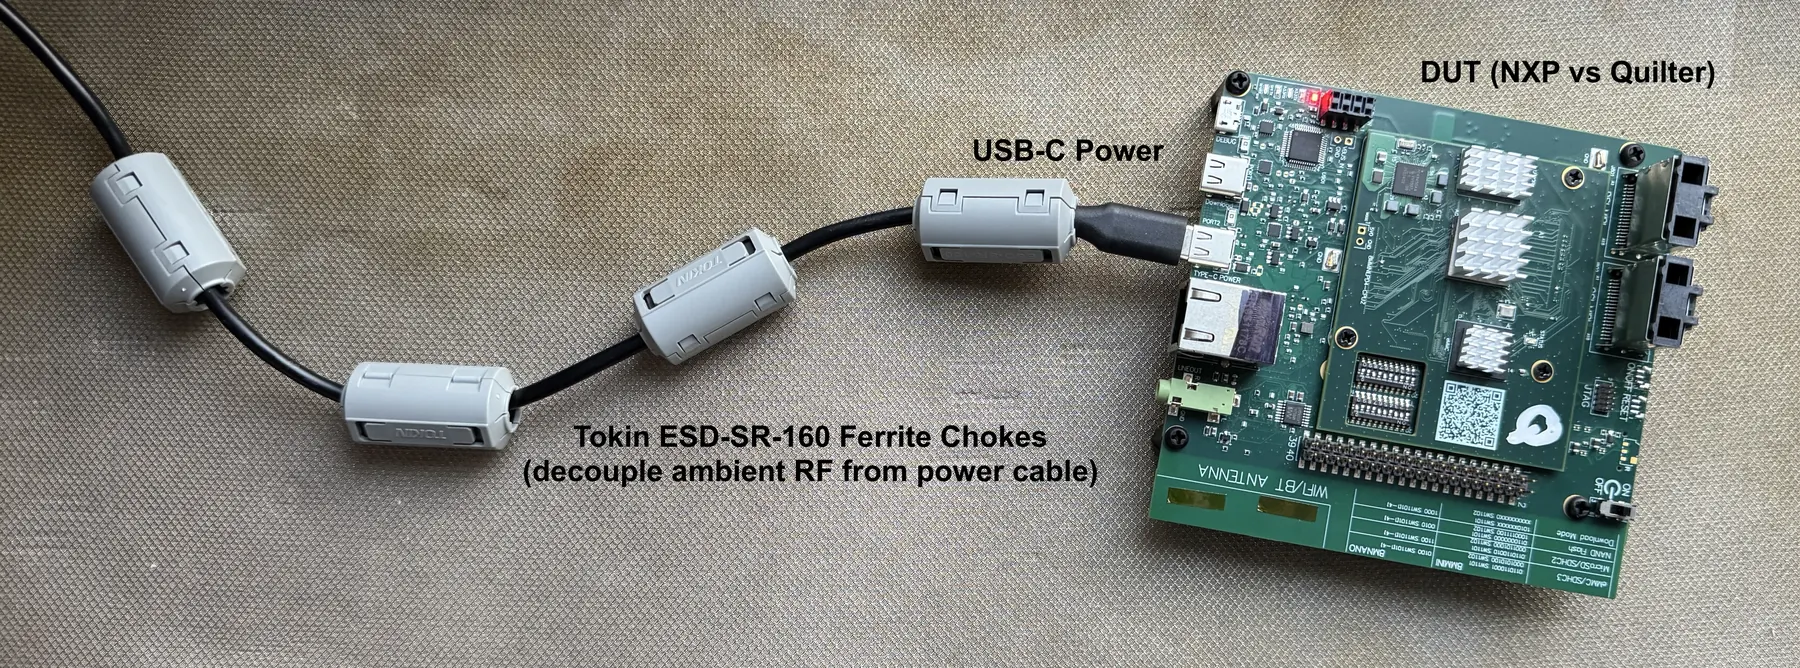
Cables attached to a board also radiate, driven by currents that originate on the board. To limit the power cable’s contribution, four Tokin ESD-SR-160 ferrite chokes on the USB-C lead decouple common-mode currents. These ferrites have useful impedance from about 100 to 600 MHz.
The Hardware Under Test
The Speedrun samples are the final boards from Quilter’s complete AI PCB design workflow. Quilter placed and routed the system-on-module and baseboard, and engineers then spent 38.5 hours on cleanup, documented in the Part 3 cleanup write-up. That cleanup included enlarging power polygons, adjusting high-current nets, and moving the L102 inductor next to its DC-to-DC converter on the baseboard. The comparison measures that complete workflow. It does not isolate the contribution of the unedited Quilter output or of any single manual change.
The NXP-design board was built at Sierra Circuits from NXP’s original design files, on VT47 laminate instead of the TU768 NXP specifies, because Sierra stocks VT47. It ran the same Linux image as the Speedrun samples.
What These Measurements Establish
In the September 14 TEM cell comparison, the completed Speedrun board measured lower than a board built from NXP’s own reference design through much of roughly 250 to 650 MHz, and the July 16 sweep showed the same ordering. Several things remain open:
- Radiated emissions only. Conducted emissions and immunity (radiated immunity, ESD, electrical fast transients) were not tested.
- Bare boards. Neither board was in an enclosure or connected to the cables a finished product would have.
- One NXP-design sample. It was built on a different laminate from NXP’s specification.
- No causal isolation. The results do not identify which design differences produced the lower levels.
Speedrun also shows why functional testing, emissions measurements, and signal integrity review are separate checks. While the boards were being fabricated and assembled, Quilter sent the final design to SignalEdge Solutions for signal integrity analysis in SIwave. The analysis found a spot where closely spaced through-hole vias left a figure-8-shaped void in the ground plane, with a memory data (DQ) line routed over it. It would have been fixed by hand had it been caught during cleanup.
The boards still run Linux reliably, possibly because memory link training at boot compensates and enough ground remains around the void. A working board does not measure how much margin that channel has, so the finding still matters. This is why Quilter treats every layout as a candidate that engineers review and sign off.
What This Comparison Tells PCB Designers
- Document the final hardware being measured. Record the board revision, stack-up, and changes made during cleanup, so readers know exactly which layout produced the traces.
- Make differences between traces auditable. Record the operating state and analyzer settings for each session, and use paired marker readings or trace exports in place of visual estimates where you can.
- Inspect local reference-plane geometry even after good bench results. Speedrun runs Linux reliably and measured well in the TEM cell, and the DQ-over-void issue surfaced only in signal integrity analysis.
As Ken puts it, “The PC board, how it is laid out, and especially the stack-up, can make or break your product, from an EMC point of view.” Quilter’s AI builds PCB layouts around dedicated ground reference planes, typically on the outermost inner layers (Layer 2, Layer N-1) of the stack the user defines, which keeps return paths for surface microstrip routing continuous across most of the board. Local discontinuities like the void above still need checking.
To examine the board yourself, download the Project Speedrun design files.
Watch the Full Conversation
About Ken Wyatt
Ken Wyatt is one of the electronics industry’s most authoritative voices on EMI and EMC. He is principal consultant of Wyatt Technical Services and has worked in EMC for more than 30 years, with a specialty in EMI troubleshooting and pre-compliance testing. After 10 years in aerospace, he joined Hewlett-Packard in 1986 and spent about 21 years there as a division EMC engineer. He developed a two-day Practical EMC Design seminar that he taught throughout Agilent Technologies worldwide, and Ben has long known him as “The EMC Doctor.” Since leaving HP, he has helped hundreds of companies with benchtop EMC characterization, troubleshooting, and pre-compliance testing.
Ken was senior technical editor of Interference Technology from 2016 to 2018. He writes the monthly “Practical EMC” column for Signal Integrity Journal and “EMC Bench Notes” for InCompliance Magazine. He co-wrote the EMI Troubleshooting Cookbook for Product Designers with Patrick André, with a foreword by Henry Ott, and co-authored the EMC Pocket Guide and the RFI Radio Frequency Interference Pocket Guide. His three-volume EMC Troubleshooting Trilogy covers measurement tools and probes (Volume 1), troubleshooting emissions (Volume 2), and immunity (Volume 3). He is a senior life member of the IEEE and a longtime member of the IEEE EMC Society, and he teaches EMC seminars in the U.S. and Europe.
Frequently Asked Questions
Did Project Speedrun Pass Formal EMC Testing?
The boards have not been through formal compliance testing. Ken Wyatt, one of the industry’s leading EMC consultants, ran a bench comparison of radiated emissions in a TEM cell, which he describes as good for pre-compliance but not formal compliance. Conducted emissions and immunity were not tested.
Was the Comparison Board a Purchased NXP EVK?
No. Quilter built it at Sierra Circuits from NXP’s i.MX 8M Mini EVK design files, on VT47 laminate instead of the TU768 that NXP specifies. Measuring a factory EVK is a proposed follow-up.
What Does the Approximately 12 dB Difference Refer To?
It is Ken Wyatt’s visual estimate, from a Signal Hound sweep at 5 dB per division, of the separation between a Speedrun sample and the NXP-design board in the part of the 250 to 650 MHz region he was discussing. The separation varies across that range. It is a bench measurement in dBµV at the TEM cell output, and it is not a far-field emissions margin.
What Does This Test Show About AI PCB Design and EMI?
In the comparison shown, the AI-designed Speedrun board had lower measured radiated emissions than a board built from the chip vendor’s reference design through much of roughly 250 to 650 MHz. The completed layout combined Quilter placement and routing with 38.5 hours of engineering cleanup. The measurements do not establish which design differences caused the result or whether other layouts would behave the same way.
What Would Still Need Testing in a Finished Product?
A finished product would need assessment against its applicable emissions and immunity requirements, using its intended enclosure, cables, peripherals, and operating conditions. These bench measurements cover only one part of that evaluation.
Related Reading
- Project Speedrun
- Part 4: Validating an AI-Designed Computer: Running Under Real Workloads
- Part 3: Cleaning Up an AI-Designed Computer
- The PCB Autorouter Was the Right Idea. Completion Rate Was the Wrong Target.
- Glossary: EMI and EMC in PCB Design · Ground Plane · Return Path · PCB Stackup · Ethernet PCB Design
Sources
- Wyatt, Ken. “AI-Designed PCB vs. NXP Reference Design: EMI Test Review With Ken Wyatt.” Interview by Ben Jordan. Quilter, November 4, 2026. YouTube video, 54:30.
- Nesterenko, Sergiy. “Cleaning Up an AI-Designed Computer: Refining the Layout for Production-Ready Hardware (Part 3/6).” Quilter, December 10, 2025.
- Nesterenko, Sergiy. “Validating an AI-Designed Computer: Running Under Real Workloads (Part 4/6).” Quilter, December 10, 2025.
- Wyatt, Kenneth. “Using a TEM Cell for Radiated Emissions and Immunity Troubleshooting.” Interference Technology, October 29, 2024.
- PCD&F. “New Book Helps Lower Risk of Compliance Test Failures.” Accessed October 27, 2026.
- InCompliance Magazine. “Ken Wyatt.” Accessed October 27, 2026.
- Altium. “Kenneth Wyatt.” Altium Resources, expert profile. Accessed October 28, 2026.
- IEEE. “2025 Milwaukee IEEE EMC Seminar: EMC Essentials for Product Designers.” IEEE vTools. Accessed October 28, 2026.
- Signal Integrity Journal. “Kenneth Wyatt.” Author profile. Accessed October 28, 2026.