


Read the Full Series
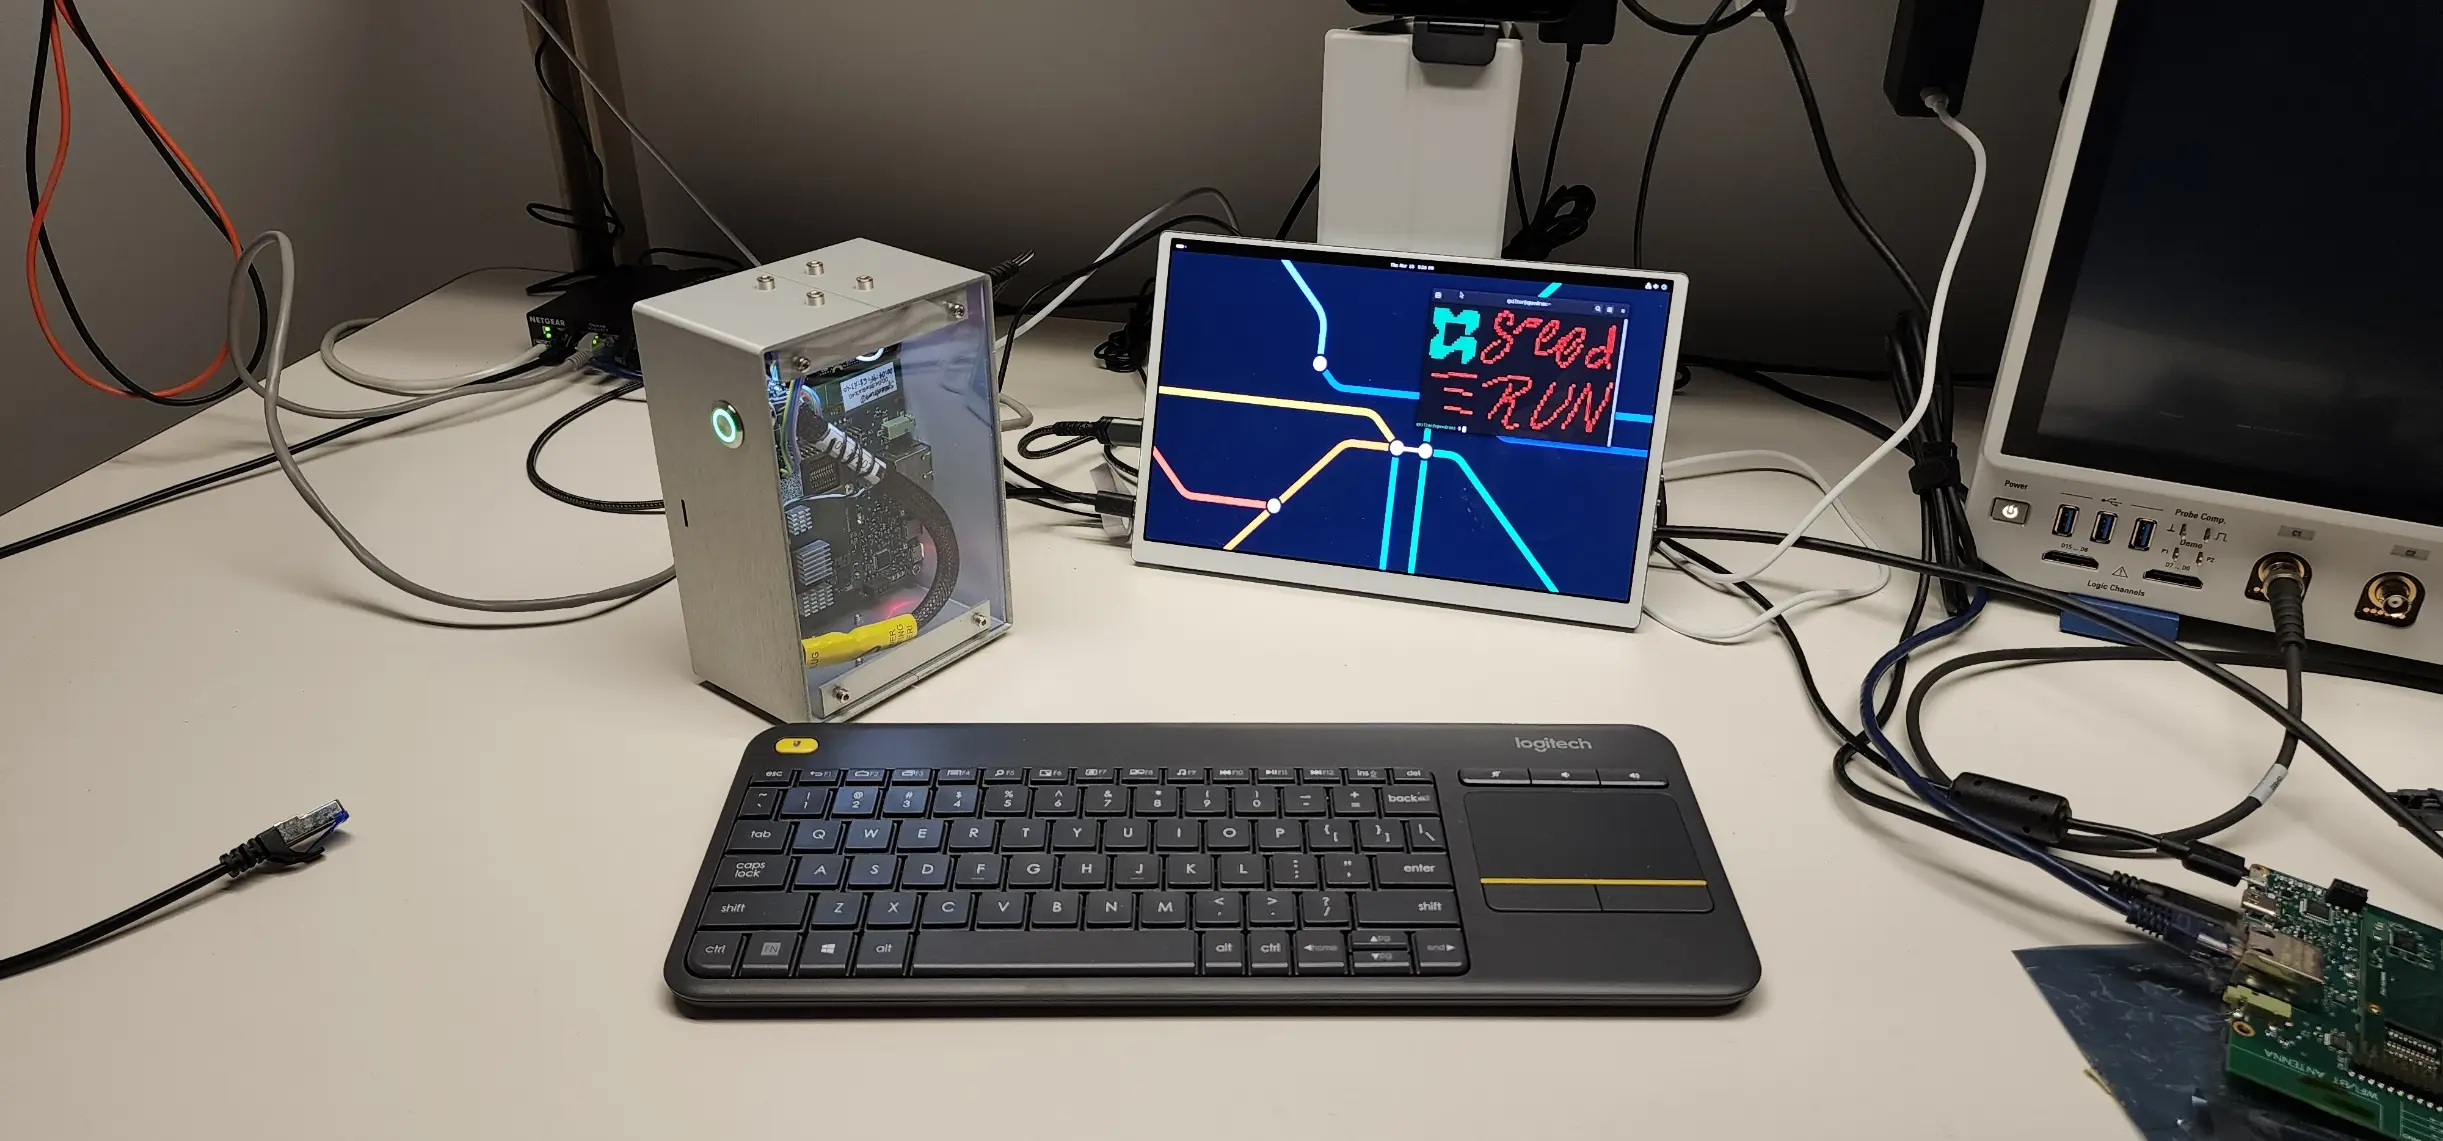
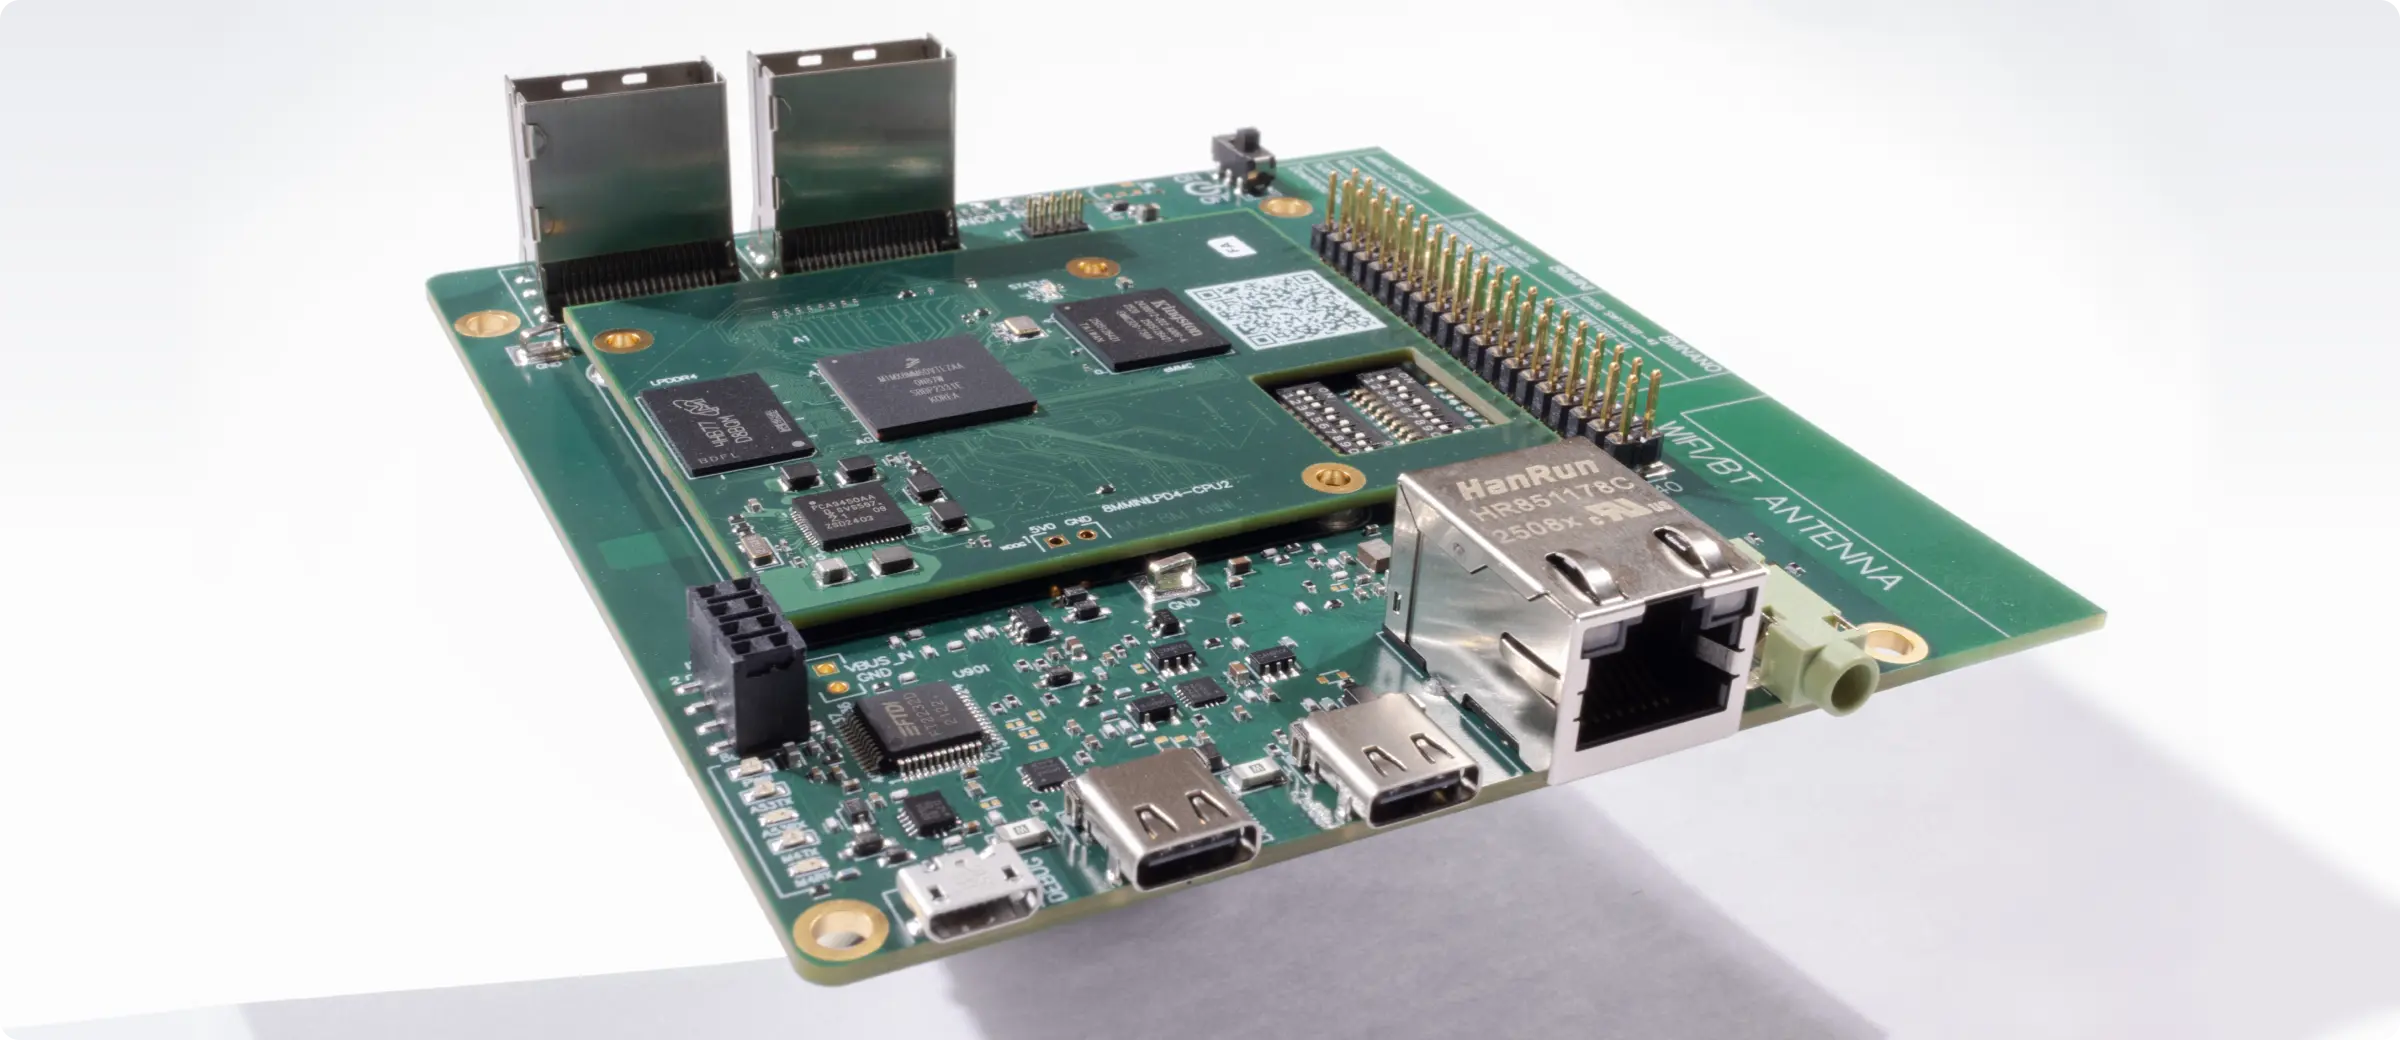
This article is one part of a walkthrough detailing how we recreated an NXP i.MX 8M Mini–based computer using Quilter’s physics-driven layout automation.
Most PCB tools can show you when a trace is too long or a pair is too close, but they cannot tell you which entire routing strategy is actually better for your board. When you are balancing vias against loss, layers against cost, and crosstalk against density, you need more than on-screen markers. This article explains how Quilter uses physics-first AI to generate multiple complete layouts and quantify the PCB routing trade-offs you care about, side by side.
Let’s define the real routing tradeoffs engineers are trying to see
If you have shipped a few high-speed or dense boards, you already know the uncomfortable truth: routing decisions are rarely “right” or “wrong.” They are tradeoffs you make under constraints, usually with incomplete information, and often under schedule pressure. The pain is not DRC errors. The pain is uncertainty about the margin.
Here are the tradeoffs that show up on almost every serious board review:
- Via count vs. insertion loss and discontinuities. Vias buy escape flexibility and congestion relief, but they add stubs (unless mitigated), transitions, and more places for impedance to drift.
- Layer count vs. cost and risk. Adding layers can reduce crosstalk and make return paths cleaner, but it changes fab assumptions, cost, lead time, and sometimes yield.
- Crosstalk vs. density. More spacing is safer for signal-integrity routing, but it can lead to longer routes, more layer changes, or even a larger form factor.
- Timing vs. meanders. Length tuning solves skew but also creates coupling opportunities, localized impedance variations, and sometimes routing congestion exactly where you can least afford it.
- Power integrity vs. area. Bigger copper, more stitching, and cleaner planes improve PDN behavior, but those decisions compete with routing channels and mechanical constraints.
What engineers want is not just “pass the rules.” They want to know how far they are from the cliff. That requires explicit, comparable metrics across entire candidate layouts:
- Total vias (by type and by interface)
- Critical net total length and length spread (buses, diff pairs, clocks)
- Worst-case coupling proxies (where parallelism and proximity concentrate)
- Layer utilization and congestion hot spots (where rules become expensive)
This is why PCB routing tradeoffs are a multi-objective problem. A single layout, no matter how well annotated, forces you to infer global consequences from local cues. A useful routing analysis tool makes the trade explicit, measurable, and easy to compare.
Here’s how traditional PCB tools try to visualize those tradeoffs
Modern EDA tools are not “blind.” Altium, Cadence Allegro, OrCAD, and Siemens Xpedition and PADS all provide real-time feedback to help you route within constraints. In practice, most teams lean on a familiar set of PCB tradeoff visualization techniques:
- Interactive DRC and constraint markers. Spacing, clearance, diff-pair rules, and length- or skew-checks appear as visual flags while you work.
- Length matching tables and bar graphs. Great for quickly spotting outliers and ensuring a bus meets a target.
- Impedance-aware rule sets. Width and spacing constraints are tied to stack-up assumptions, sometimes aided by impedance calculators.
- Congestion and density views. Heatmaps and layer utilization indicators that expose where the board is tight, and where it is still routable.
Then, when the design becomes more complex, teams step outside the PCB editor for deeper analysis. Signal integrity tools like Cadence Sigrity, Siemens HyperLynx, Keysight ADS, and Ansys SIwave or HFSS can show eye diagrams, reflections, S-parameters, and field plots that turn “maybe risky” into “definitely risky.” (Exactly which tool is used varies by organization and budget, but the workflow pattern is consistent.)
KiCad deserves a quick mention here, too. Even with a lightweight stack, teams can still use interactive DRC, length tuning, and differential pair routing as baseline visibility into constraint compliance.
This entire ecosystem is valuable, and it has shipped a lot of hardware. The limitation is not the capability. The limitation is that these views are optimized for validating and fixing a single in-progress layout, rather than automatically exploring the design space of multiple viable routings.
Where do today’s routing views fall short when decisions really matter?
Traditional visualization is effective at identifying local issues. It is much worse at telling you which global strategy is best.
Here is what that looks like in real life:
- You route until it “mostly works.”
- You identify tight spots, add exceptions, tweak rules, and reroute sections.
- You run deeper checks, then iterate again.
- You end up with a board that passes, but you still do not know whether you made the best trade-offs among cost, performance, and manufacturability.
If you want to do a real trade study in Altium or Cadence, the process is usually manual and brittle. You copy the project, adjust rules or stack-up assumptions, re-route (often by hand), re-run checks, and then try to compare the results. Even if you are disciplined, you end up exporting metrics to a spreadsheet because there is no clean side-by-side comparison view of whole-board outcomes.
This is why answering questions like these is so expensive:
- “What if we allow one more layer to reduce crosstalk in that interface?”
- “What if we trade fewer vias for slightly longer routes, does SI improve?”
- “What if we prioritize return-path continuity over shortest path length?”
The tools will let you test those hypotheses. They just will not do it automatically. They are excellent verification engines, but they are not exploration engines. So the “routing analysis tool” becomes a human process: copy, tweak, rework, measure, and hope you did not introduce a new failure mode elsewhere.
How can AI turn routing tradeoffs into concrete, comparable outcomes?
Quilter is designed around a different premise: instead of asking an engineer to produce one routing solution and then interpret it, generate multiple complete candidates and score them against the objectives that matter. Quilter describes itself as a physics-first AI system for PCB layout automation that can complete placement, routing, and physics validation, producing multiple candidates in hours.
At a high level, the workflow looks like this:
- Ingest your existing CAD project. Quilter supports importing projects from common toolchains (Altium, Cadence, Siemens, KiCad) so the starting point is your real schematic, constraints, and floorplan decisions.
- Lock what must not change. You define the board outline, pre-place connectors, keepouts, and any mechanical constraints. Quilter works within your intent, rather than inventing a new design.
- Run an optimization loop. Quilter uses reinforcement learning to explore routing and placement decisions and evaluates candidates against physics-aware constraints and objectives.
- Produce multiple viable outcomes. Instead of one “best guess,” you get several candidates that reflect different priorities.
The practical unlock is the scoring. Multi-objective questions become visible when you can compare candidates using consistent metrics:
- Via count and layer usage
- Critical net total length and length distribution
- Congestion and layer utilization patterns
- Proxies for coupling and return-path quality (based on the constraints and physics checks Quilter performs)
This is the difference between visual aids and quantified tradeoffs. Visual cues can tell you where you might be close to a limit. Quantified candidates tell you what you are paying, and what you are buying, for each routing strategy.
Here’s what side-by-side AI candidates actually look like
Let’s use a simplified example: a dense high-speed interface board with a few critical buses, differential pairs, and a tight mechanical outline. You run Quilter twice with two objective profiles:
- Candidate A: Minimize Cost (favor fewer layers and manufacturability constraints)
- Candidate B: Maximize Performance (favor SI margin, cleaner channels, fewer transitions)
You do not need a perfect model of reality for this to be useful. You need consistency. If every candidate is evaluated the same way, the deltas become actionable.
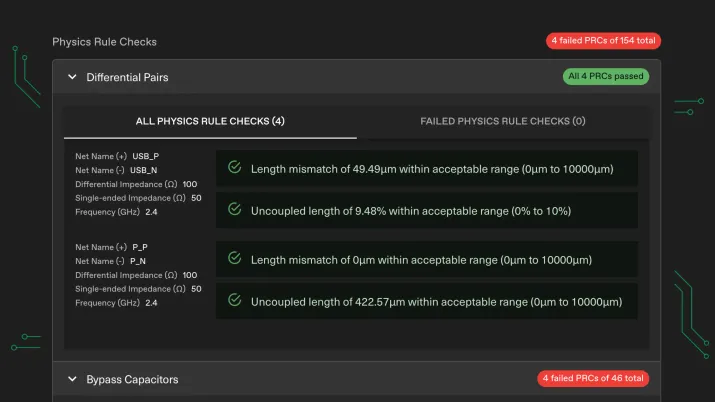
Figure 1: AI-driven layout candidate comparison
To make this feel like a real dashboard, here are the metric labels in the same “UI-ish” language teams tend to use during review:
- Layer Count
- Via Count
- Critical Net Total Length (mm)
- Estimated Crosstalk (worst-case, dB)
In this example, the performance-optimized candidate spends one extra layer to reduce via count and shorten critical nets. That is a classic tradeoff: slightly higher stack-up cost in exchange for cleaner routing channels, fewer transitions, and better coupling behavior.
The key is what you do next. Instead of arguing from screenshots, you can argue from outcomes:
- If your program is cost-constrained, Candidate A might be “good enough,” and the table makes it clear what you are accepting.
- If your program is risk-constrained (first-pass bring-up, tight SI margin), Candidate B may be the better bet, and the cost delta is explicit.
This is what an AI-driven layout looks like when it is actually usable by senior engineers: the machine explores, but the engineer decides, with metrics that match real trade language.
Want your own routing tradeoff table, not a generic example? Upload a sample board and see side-by-side candidate metrics in under a day. Get started on Quilter here.
What results can teams expect versus an Altium-only workflow?
The fairest comparison is not “replace Altium.” It is “change what Altium is used for.”
In an Altium-only flow (or any single-tool flow), the PCB editor serves as both the exploration and verification environment. That is why timelines stretch. You are trying to discover the best strategy while simultaneously finishing the board.
With Quilter plus your existing CAD tool, the loop changes:
- Exploration happens in parallel. Quilter generates multiple candidates quickly, so you can examine tradeoffs before committing to a single strategy.
- Your CAD tool becomes the final verification and polish layer. You still run your normal DRC and SI checks, and you still do last-mile edits where human judgment is needed.
What does that mean in practice?
- For a high-speed validation board that might take a couple of weeks of routing, review, and rework, teams can see initial candidates in hours, then spend their time selecting and refining rather than brute-forcing the first viable route.
- For electrical engineers, it means you can run multiple routing strategies in parallel (different stack-ups, different objectives, even different manufacturers) instead of picking one path and hoping it closes.
- For R&D managers, it reduces schedule risk because the layout no longer becomes a single-threaded bottleneck.
If you are looking for an “Altium comparison” that reflects reality, this is it: Quilter does not replace your PCB toolchain. It increases design capacity by making the expensive part of trade studies abundant.
Here’s how to plug Quilter into your existing PCB toolchain
The easiest way to think about Quilter is as a routing analysis tool that sits on top of what you already do, then hands you back a native project you can finish in your preferred environment.
A practical step-by-step flow looks like this:
- Prepare the CAD project you already trust.
- Confirm your schematic connectivity.
- Clean up net classes for critical interfaces (diff pairs, clocks, DDR, SerDes).
- Make sure board outline, keepouts, and mounting features are correct.
- Upload your project to Quilter.
- Quilter is built to work with existing workflows and return output in the same format you submitted, so you can keep your standard release process intact.
- Lock placements and constraints that define intent.
- Pre-place connectors and mechanical-critical components.
- Define what must not move and what is flexible.
- Define objective profiles for your trade study.
- Example profiles:
- Minimize Cost (layer count and manufacturability weighted)
- Maximize Performance (SI margin and fewer transitions weighted)
- Balanced (a middle ground you can defend in review)
- Example profiles:
- Generate candidates in parallel.
- Review side-by-side metrics inside Quilter first.
- Then inspect the actual layout behavior, especially on critical interfaces.
- Download the selected candidate back into your native tool.
- Run your normal DRC workflow.
- Perform targeted SI checks where your organization requires them.
- Make any final edits and produce fab outputs as usual.
Downloadable checklist
To make your first run smoother, here is a one-page PDF you can share internally:
Download: Inputs to Prepare Before Running Your First Quilter Trade Study (PDF)
Let’s talk about when AI-driven routing analysis makes the biggest impact
AI-driven routing analysis is not equally valuable for every board. It shines when the design space is large and the cost of rework is high.
Common high-leverage cases:
- IC evaluation boards and bring-up hardware. These boards often have dense BGAs, high-speed interfaces, and tight timelines. Quilter explicitly targets these programs with fast candidate generation and physics-driven review.
- Design validation boards. Validation teams lose weeks when layout becomes the critical path. Generating multiple candidates quickly can reduce the “first pass uncertainty” that drives re-spins.
- Backplanes and interconnect boards. Via count, insertion loss, and crosstalk tradeoffs become brutal at high layer counts. Quilter highlights this category as a place where autonomous layout can dramatically compress timelines.
Industry patterns map cleanly too: semiconductors, robotics, consumer electronics, and aerospace and defense are all domains where schedule pressure is constant and routing complexity is non-trivial. Quilter’s positioning is built around unblocking these demanding programs.
One more point that matters for senior teams: this is not about replacing expert PCB designers. It is about reserving expert time for the decisions that only experts can make. Let the machine generate and score variants, then let humans do what humans do best: define intent, spot risks, and decide which trade-offs are acceptable.
Where to go next if you want AI to explore your next layout
If you want to evaluate Quilter without betting a mission-critical program on day one, start with a board that is representative but not existential:
- A test fixture or evaluation board that still contains your typical constraints
- A validation spin where time matters, but the risk is manageable
Before you run it, write down the two tradeoffs you care about most. Keep it simple:
- Via count vs. layer count
- Crosstalk vs. density
- Timing closure vs. meanders
Then compare Quilter’s candidate metrics and visuals directly against your existing PCB tradeoff visualization process in Altium, Cadence, Siemens, or KiCad. You are not trying to prove AI magic. You are trying to determine whether the system can generate options you would actually consider, and whether the quantified deltas make decision-making faster and more defensible.
To try it on a real project, upload an existing CAD design and let Quilter generate multiple candidates you can inspect in your native toolchain. Start on Quilter’s Product page and follow the Get Started path.